Extreme temperatures mean asking more of mechanical systems to keep building occupants comfortable. It’s even more important to keep room temperatures in range in schools and businesses, where extreme heat and cold can threaten learning outcomes or the bottom line. At the same time businesses with large footprints are struggling with rising utility costs. For example, energy is the largest line item for school districts behind staff, and HVAC is the biggest driver of energy consumption. Nonetheless, schools and brick-and-mortar businesses can’t simply change their hours of operation or let their occupants be uncomfortable in order to save money. The answer lies in strategically cooling or heating buildings during parts of the day that carry lower rates. For commercial customers, the complexity of interpreting utility bills and turning that into actionable control decisions can feel like a nearly impossible task.
“Rates are becoming increasingly complex,” says Josh Keeling of Utility API. “What you pay for energy, the cost of energy by time period, shifting focus on peak-time usage, changes in seasonality, net billing (to account for energy produced on site)—it’s basically impossible for a human to understand.”
And yet, with strained budgets, aging equipment, and hundreds if not thousands of occupants, employees, and customers to keep comfortable, someone has to. At Community Energy Labs, parsing electricity bills is the first thing we do for potential clients to see how much opportunity exists for shifting energy loads to reduce costs.
Breaking Down Your Commercial Utility Bill
We use GreenButton data providers like UtilityAPI to view bills, but you can also request your bills and usage directly from your utility. The first thing we look at is the general service rate for the energy charges (as opposed to demand charges, which we’ll talk about later) and the rate sheet. Thi can usually be found on the utility provider’s website. Depending on the state and utility territory, commercial customers might have “time of use” rates and may be subject to special conditions based on whether they produce energy on site. Commercial customers with larger campuses hosting multiple separate buildings are often on the most expensive usage tiers because of the distributed HVAC and controls.
For example, in the image below, this campus hosts multiple buildings and significant amounts of HVAC units in a hot climate. As a result, they are on a TOU-GS-3, or general service rate, that typically applies to large commercial and industrial customers.
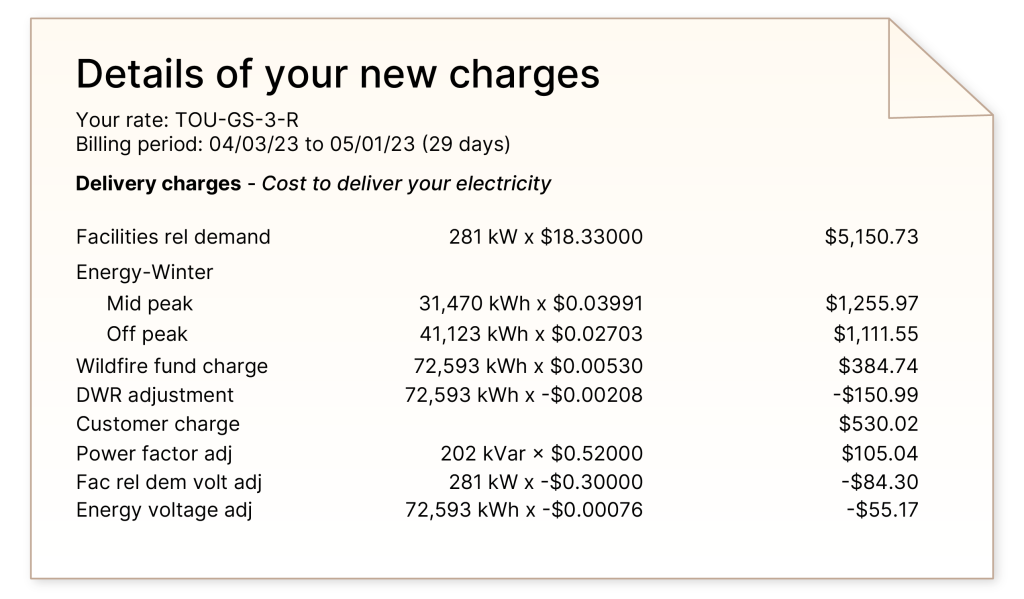
Once you have the name of the rate (in this case, it’s “TOU-GS-3-R”), you can move to the rate sheet. In this case, the “R” at the end of the rate type means the customer has Option R, which we find on the rate sheet. We look to see how the rate is structured, as it can include several special conditions, including:

We add the per-kilowatt-hour (kWh) rate (Total column) and the per-kWh generation rate (UG column) to arrive at a total cost per kwh for each special condition to uncover differences in the charges between different times of day or seasons. In this case, the summer rates vary considerably, with peak rates costing almost double those of mid-peak and more than triple off-peak. This tells us there is significant opportunity to shift energy usage to times of day when it’s less expensive.
| Total (cents) | Uplift (cents) | Total Cost (cents) | |
|---|---|---|---|
| Summer On-Peak | .29 | .21 | -50 |
| Summer Mid-Peak | .16 | .10 | -28 |
| Summer Off-Peak | .09 | .06 | -15 |
| Winter Mid-Peak | .07 | .09 | -14 |
| Winter Off-Peak | .05 | .05 | -10 |
According to its rate sheet, this utility defines the summer period as being from June 1–October 1 and on-peak hours as 12 p.m.–6 p.m. In our school example, most schools are out for the summer but return well before the October cutoff, and peak pricing overlaps with school hours, helping us pinpoint where there is the most urgency in load shifting. A look at bill totals from at least the previous 12 months, specifically what percentage comes from demand costs, confirms this customer is paying significantly more during the months of August and September than any other months of the year.
Understanding Demand Costs
Demand charges are based on your single biggest surge of electricity use in the billing period, not your overall consumption. Electricity usage (kWh) measures the total amount of energy you use over time, like the number of gallons of water you used in a month. Demand (kW) measures the highest rate at which you use power at any one moment during the billing period, like the fastest flow of water through the pipe at once. You can also think of it like driving:
kWh charges are like the total miles you drove on your trip—while your speed at any given time might vary at the end of the trip you can say “I traveled 130 miles in 2 hours.”
Demand charges are like getting a speeding ticket. It doesn’t matter what speed you were going ten minutes ago, if a cop clocks you going 80, that will impact your insurance costs for the next billing period.
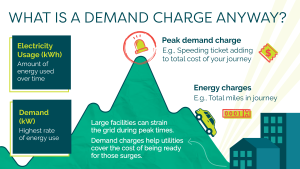
Energy charges are how much electricity you consume while demand charges are how much your peak power draw is, even if it lasts only 15 minutes. Even if you only hit that top speed once, your bill reflects it because the utility must be ready to handle that surge in power again.
Large facilities (like schools or businesses) can put big strains on the grid when many devices turn on at the same time (lighting, HVAC, computers, etc.). Even if it’s brief, the utility has to maintain wires, transformers, and generation capacity big enough to handle that peak. The demand charge helps cover that infrastructure cost.
Looking at the same bill as above, where it says “facilities-related demand,” during the month, this school’s highest 15-minute power use was 281 kW. That number was multiplied by the demand rate ($18.33 per kW). The result was a charge of about $5,151 per month—a big portion of the total bill.
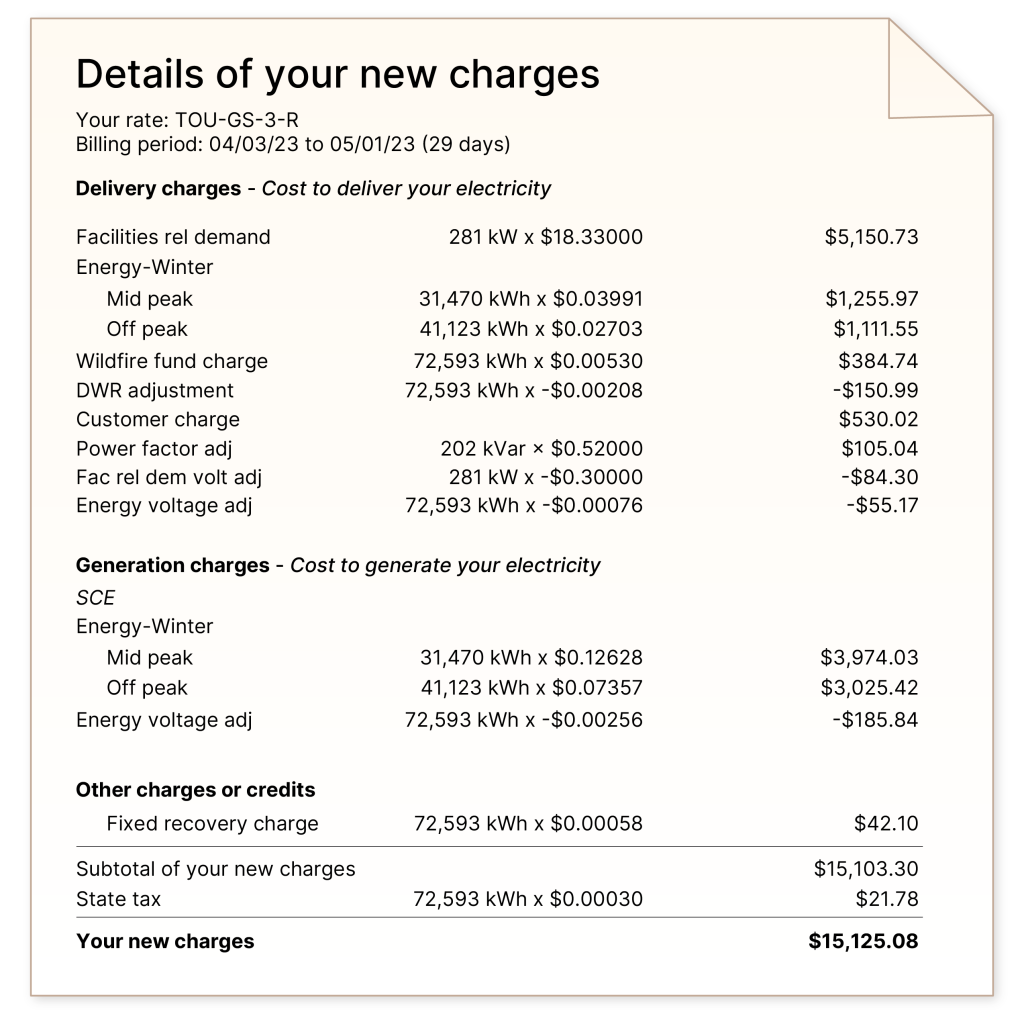
For this customer, demand charges represent one-third of their bill, but if you have solar and have a net metering plan, which would reduce the amount you spend on energy (kWh), then demand charges (kW) can make up three-quarters or more of your entire bill.
Using Information from Utility Bills to Lower Energy Costs
Any day is a good day to lower your usage, but focusing on the most critical parts of the year or the day is going to be more valuable than trimming during off-peak times. One simple way to shift usage to times when rates are less expensive is to start air conditioners earlier than you usually would in order to pre-cool rooms and avoid turning them all on at once.
“If we know the rate is higher at 1 p.m., we might start bringing the temperature down to the bottom of the range at 10,” says Rebecca Peredo, CEL Director of Customer Success.
Rooms can “coast” at comfortable temperatures for a while—the idea is to get rooms to ideal temperatures when rates are cheaper and then let them coast for as long as possible during more expensive times. How long depends on several factors, including the materials of the building, room layout, number and orientation of the windows, etc.
An effective technique to combat demand charges specifically is to stagger your HVAC units, so they don’t all turn on at once. Many commercial campuses have tens or up to hundreds of HVAC units; turning them all on at once makes the water rush through the pipe (so to speak) all the faster, making your biggest surge that more expensive.
CEL uses model predictive control to tell exactly how long a room can stay in the desired temperature range that is comfortable for occupants, while shifting energy and demand. Our solution uses this data, weather information, and AI to “orchestrate” AC units, so they run only where and as long as they need to keep occupants comfortable.
“Building and facilities managers don’t have time to run around checking the temperatures in each classroom and office and adjusting individual thermostats based on whether it’s peak time or not,” says CEL CEO Tanya Barham. “Just let the robot do it. The data from your utility bill is the way to put it to work for you.”
If you’re interested in having CEL review your utility bills to see whether our virtual engineer can save you the hassle of managing your energy bills, please contact us.